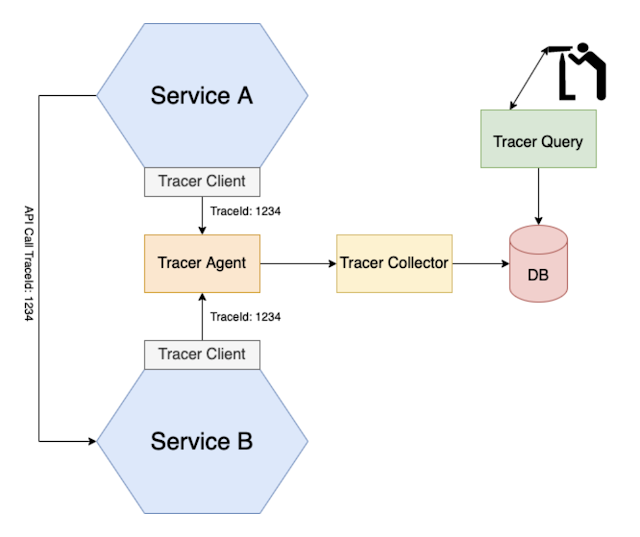
Problem
How to understand the behavior of an application and troubleshoot problems?
Forces
- External monitoring only tells you the overall response time and number of invocations - no insight into the individual operations
- Any solution should have minimal runtime overhead
- Log entries for a request are scattered across numerous logs
Solution
Instrument services with code that
- Assigns each external request a unique external request id
- Passes the external request id to all services that are involved in handling the request
- Includes the external request id in all log messages
- Records information (e.g. start time, end time) about the requests and operations performed when handling a external request in a centralized service
Imagine you are troubleshooting a slow API response. Multiple services may be involved in that API response. Using distributed tracking can provide insight into what your application is doing.
A distributed tracer is similar to a performance profiler in a monolithic application. Records information about the service calls that are made when handling a request. You can then see how the services interact during the handling of external requests, as well as how much time is spent on each service.
Each external request is assigned a unique ID and tracked as it flows from one service to another on a centralized server that provides visualization and analysis. Distributed tracing servers include Zipkin, Jaeger, OpenTracing, OpenCensus, New Relic, etc.
By default, most AWS services centralize their log files. The primary destinations for log files on AWS are Amazon S3 and Amazon CloudWatch Logs. For applications running on Amazon EC2 instances, a daemon is available to send log files to CloudWatch Logs.
Lambda functions natively send their log output to CloudWatch Logs and Amazon ECS includes support for the awslogs log driver that enables the centralization of container logs to CloudWatch Logs.
For Amazon EKS, either Fluent Bit or Fluentd can forward logs from the individual instances in the cluster to a centralized logging CloudWatch Logs where they are combined for higher-level reporting using Amazon OpenSearch Service and Kibana. Because of its smaller footprint and performance advantages, Fluent Bit is recommended instead of FluentD.
The following figure illustrates the logging capabilities of some of the services. Teams are then able to search and analyze these logs using tools like Amazon OpenSearch Service and Kibana. Amazon Athena can be used to run a one-time query against centralized log files in Amazon S3.


